
Passenger is compatible with Node.js debugging tools such as the builtin Node.js debugger and node-inspector.
The builtin Node.js debugger is a simple terminal-based debugger that accepts terminal commands, while node-inspector is a GUI based on the Blink Developer Tools. This tutorial teaches you how to use those tools with Passenger.
The idea is that you start a Node.js app with a debugging port enabled. You then attach the debugger interface to the debugging port.
Step 1: write a Node.js debugging wrapper script
The goal of this step is to ensure that Passenger starts Node.js application processes with the correct debugging parameters. This is achieved by making a wrapper script.
Create a file /usr/local/bin/node-passenger-debug-wrapper containing:
#!/bin/sh

## Uncomment the following if your 'node' binary is
## in a non-standard location, and Passenger complains
## about not being able to find the 'node' command.
#
# export PATH=/path-to-nodejs-bin-directory:$PATH

# Tells Node.js to open a debugging port on 7500.
# Feel free to change the number to anything you like.
exec node --debug=7500 "$@"
Make sure this wrapper script is executable:
sudo chmod +x /usr/local/bin/node-passenger-debug-wrapper
Step 2: configuring Passenger
You must configure Passenger to do two things:
- Ensure that Passenger uses the wrapper script to start Node.js apps.
- Ensure that Passenger only starts 1 process for your application. It is currently not possible to debug apps that have multiple processes.
Nginx configuration:
# Use debug wrapper script.
passenger_nodejs /usr/local/bin/node-passenger-debug-wrapper;
# Ensure that min_instances is set to 1, not a higher number.
passenger_min_instances 1;
Apache configuration:
# Use debug wrapper script.
PassengerNodejs /usr/local/bin/node-passenger-debug-wrapper
# Ensure that MinInstances is set to 1, not a higher number.
PassengerMinInstances 1
Standalone invocation:
passenger start \
  --nodejs /usr/local/bin/node-passenger-debug-wrapper \
  --min-instances 1 \
  --app-type node \
  --startup-file app.js
If applicable, restart the web server to have the change applied.
Step 3: start app, attach the debugger
Make a request to your app so that Passenger starts it:
curl http://www.yourapp.com/
You can now attach a debugger interface to your app.
Node.js builtin debugger
To use the Node.js builtin debugger, run node debug localhost:7500. It will drop you in a debugging prompt:
$ node debug localhost:7500
connecting to localhost:7500 ... ok
debug>
At this point, you cannot debug the application yet. The app must be paused at a point where it is executing Javascript. So instruct the debugger to pause the app using the pause command.
debug> pause
When you have executed this command, two things can happen. The first thing is that you immediately see the source line where the app is paused at, like this:
break in net.js:1301
 1299 };
 1300
>1301 function onconnection(err, clientHandle) {
 1302   var handle = this;
 1303   var self = handle.owner;
The second thing that may happen is that the pause command doesn't appear to have any effect. This can happen if the app is currently waiting for an I/O event instead of executing Javascript. In this case, you must wake the app up by making a request to it:
curl http://www.yourapp.com
If you go back to the debugger, you should see that it has paused the app at a Javascript source line.
Node-inspector
Install node-inspector if you haven't already:
npm install -g node-inspector
Then start node-inspector, telling it where the app's debugging port lies:
$ node-inspector --debug-port 7500
Node Inspector v0.10.1
Visit http://127.0.0.1:8080/debug?ws=127.0.0.1:8080&port=7500 to start debugging.
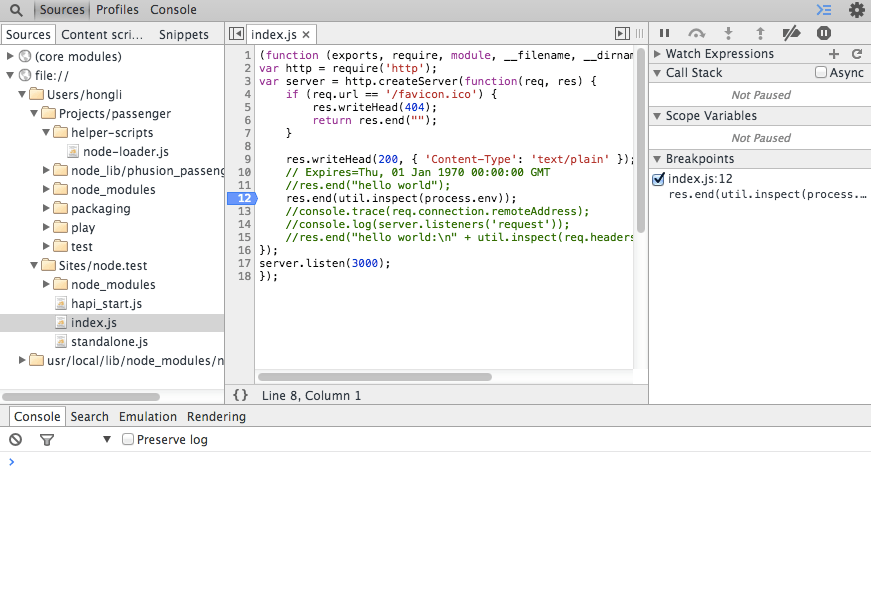
Visit the URL that node-inspector tells you to visit. You should see the debugging interface.
Conclusion
Debugging Node.js apps on Passenger requires just a few config options. For future versions, we are looking into introducing features that make invoking debuggers even easier.
 Follow on Github