
In this article we take a closer look at the performance analysis features of Union Station, and how the features assists in identifying important performance issues within your application. In the demonstration we find an actual production performance issue that we subsequently resolve. This article is the first installment in a series of articles on how to get the most value out of Union Station.
Detecting issues on the Performance Analysis page
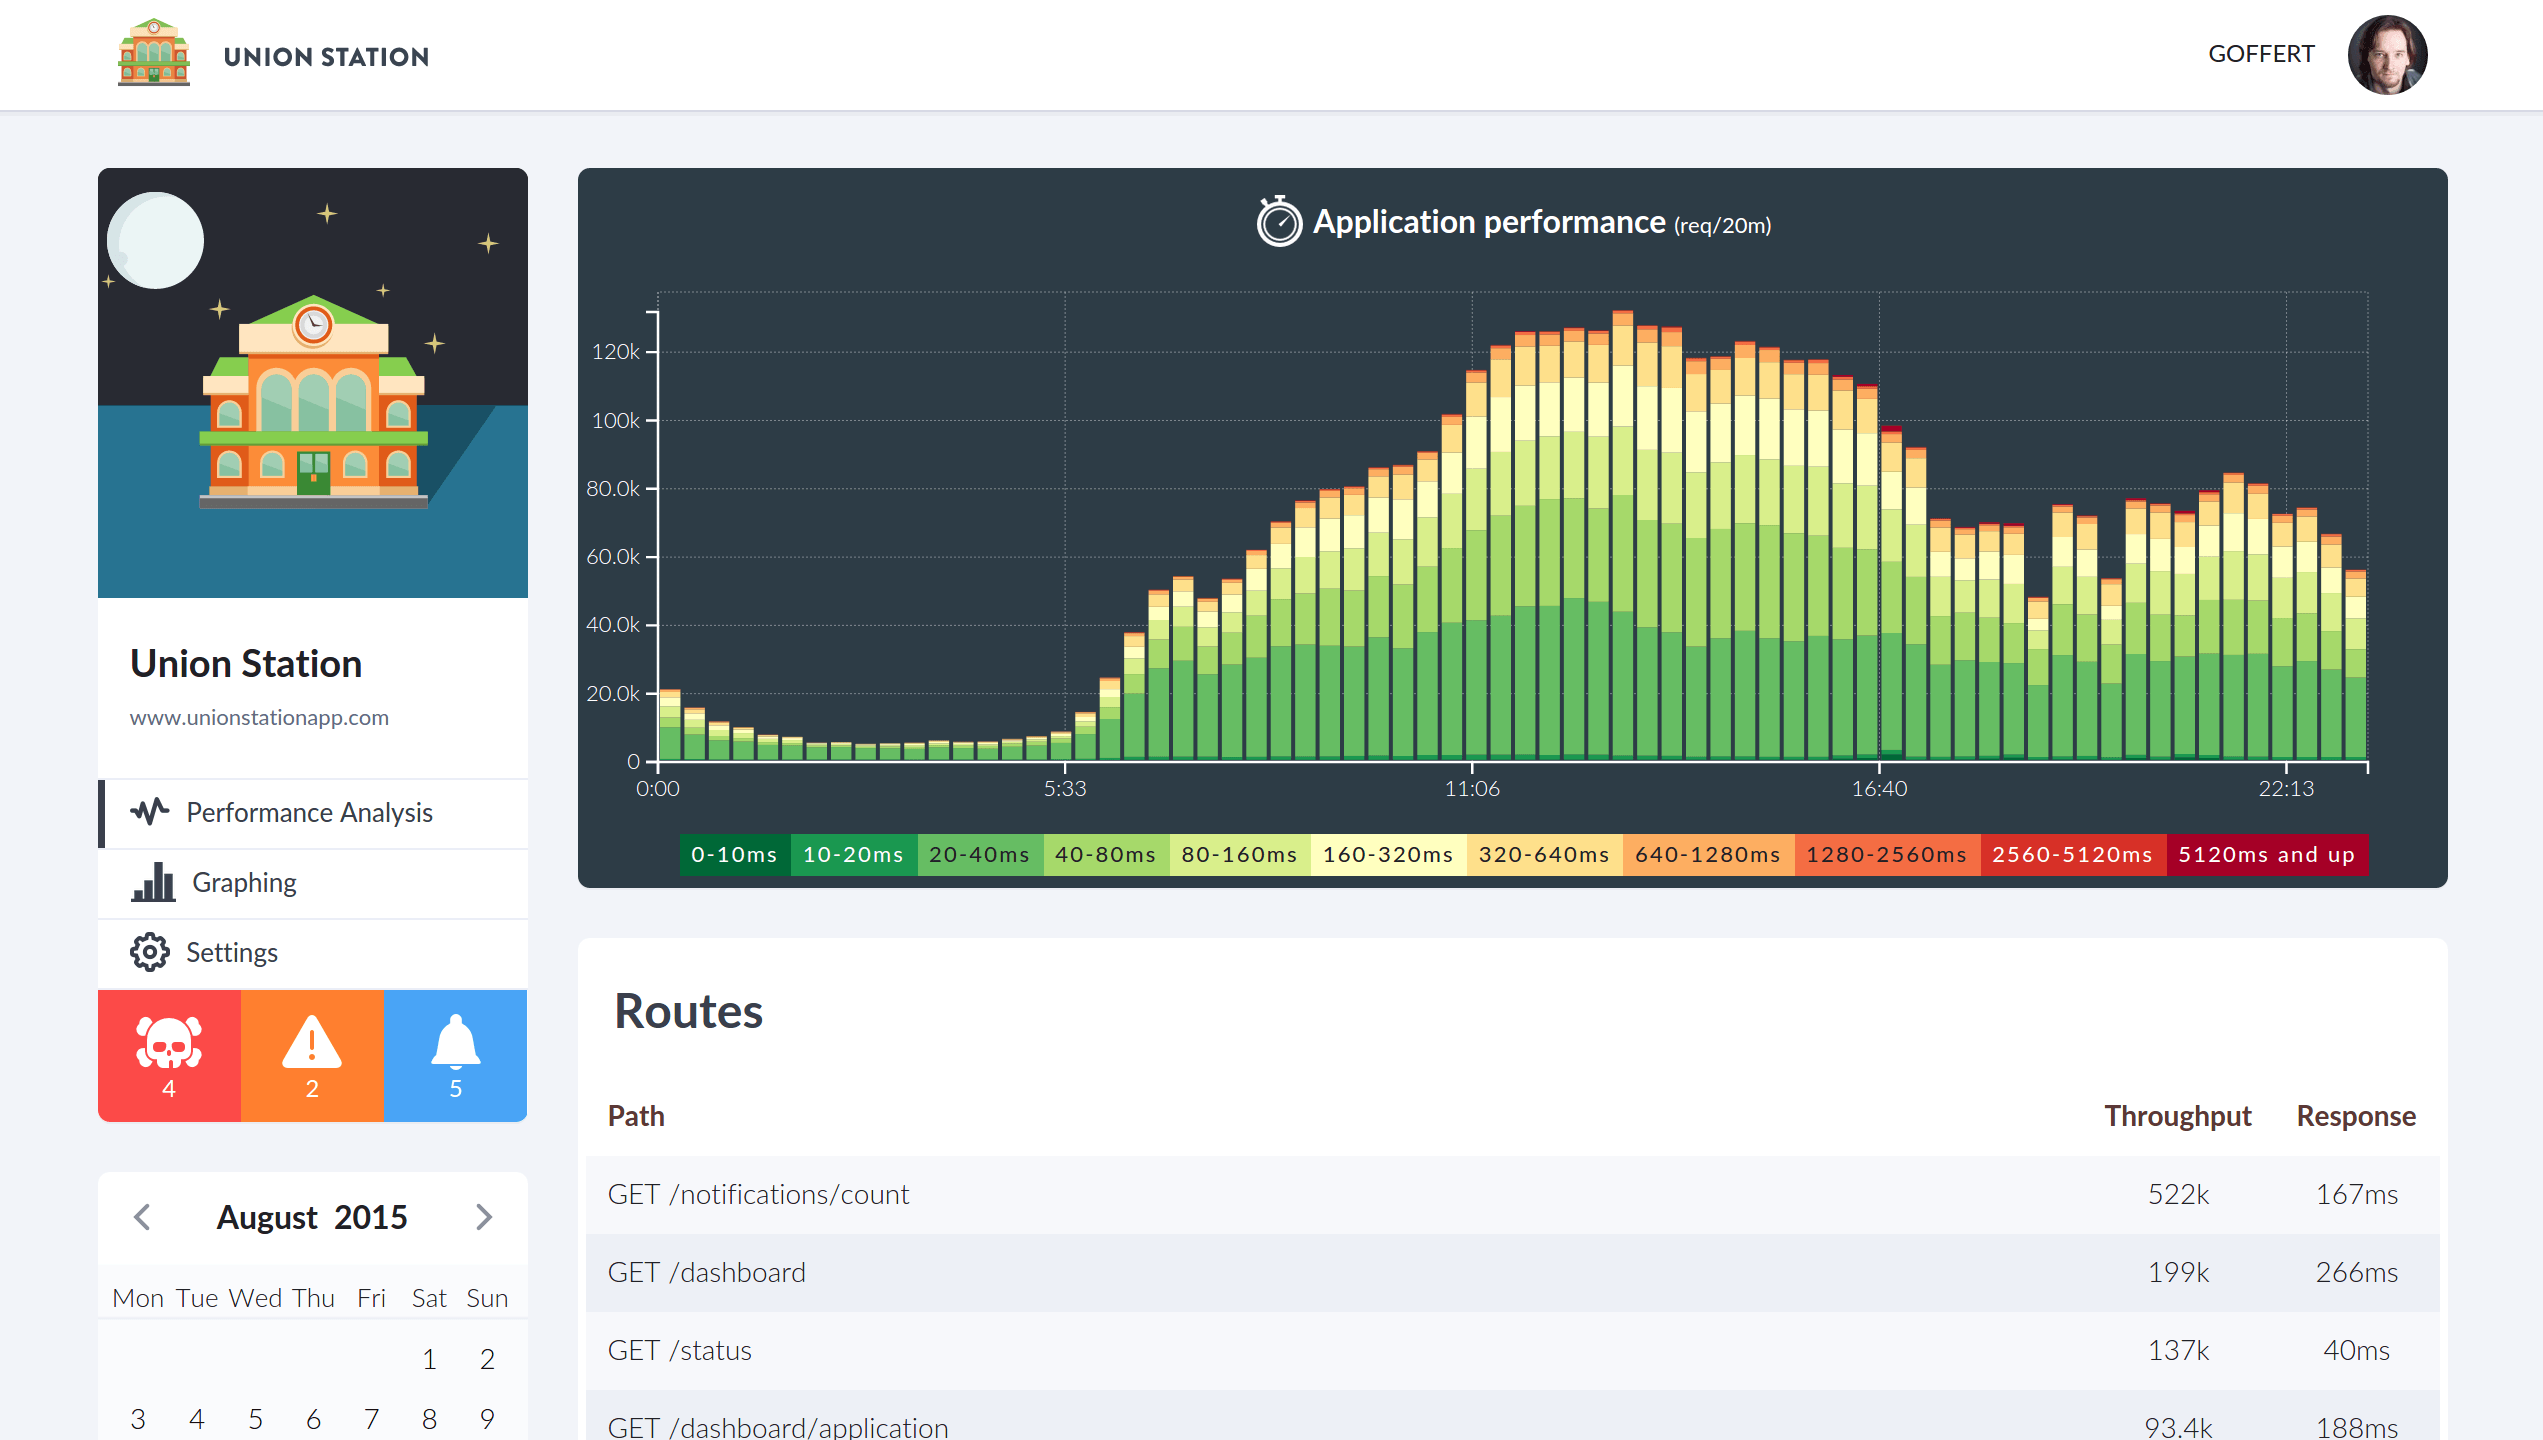
Right at the top of the performance analysis page sits the performance graph. The performance graph was designed to be the most important tool in Union Station for identifying performance issues. Common scenarios affecting application performance are temporary increases in traffic or shifts in traffic patterns that create a disruption. The Application Performance graph helps quickly identifying these disruptions, and allows a developer to quickly drill down to the root cause of the issue.
Below is an example of such a scenario. During the afternoon we find a larger than usual number of slow requests, which is cause for further investigation. Clicking on one of the offending time intervals we are presented with a more detailed overview of request performance at that specific time. We are most interested in knowing the makeup of the slowest requests, and filtering on that specific slot, we drilled down directly to the individual requests that make up the anomaly we are investigating. From here we can clearly see that a request for a specific resource was to blame for our performance issue.
Union Station does not stop there however. After drilling down to the individual requests we can select one such request and see what exactly is going on inside that request. Below you can see the specific database query that caused the delay. The query looks up a maximum of 10 'alerts' related to an exception notification. All the other Mongo queries are quick, and the query is relatively simple so this points us to inspect the database itself and sure enough the table was missing an index on the 'notification_id' field that this query was matching on.
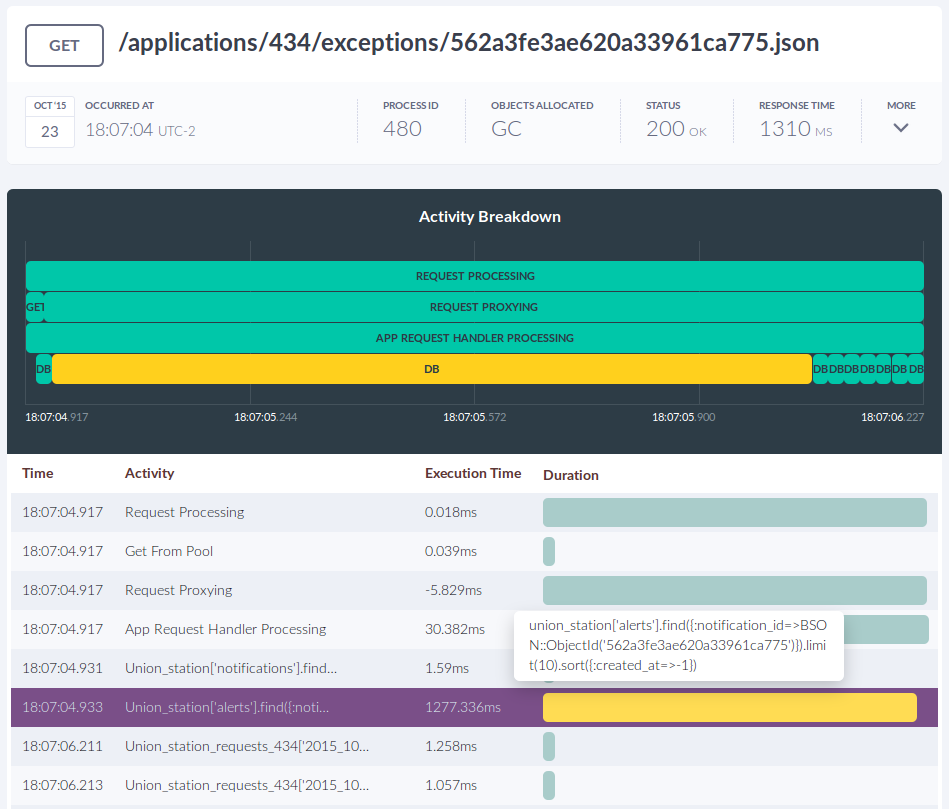
We used the performance graph and its powerful drill down feature, to identify a circumstance in which our application was not performing as expected. We then used the activity break down of an individual request to identify a specific database query that was slow and used that information to apply a fix that resolved the issue.
 Follow on Github