
Union Station's weekly summary is an email service to keep your team up to date on the current status of your application. The summary contains statistics on throughput, performance, deployments, and system load. Not just of the past week, but also compared to the values of the week before. The aim of the summary is to give a birds eye overview of the health of your application and its development, all directly from your inbox.
The Union Station weekly summary is a feature of Union Station, check it out and sign up for a free trial here!
Throughput
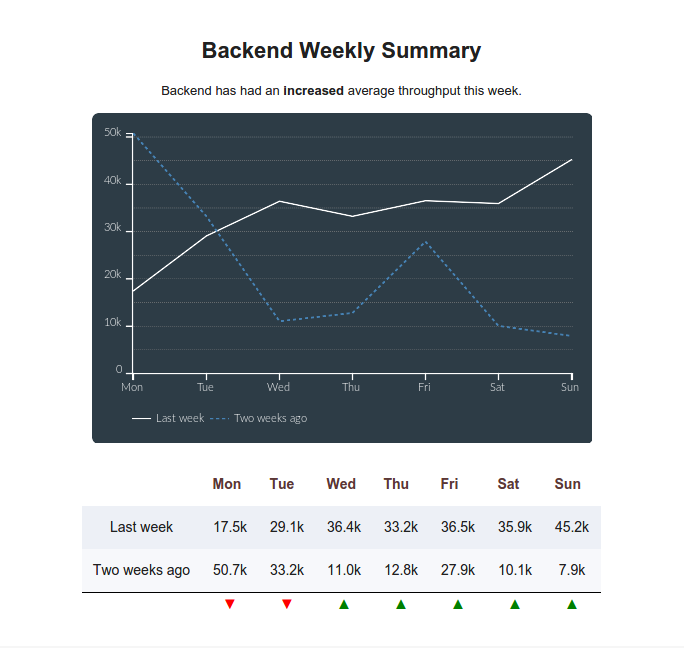
The weekly summary starts off with an overview on how your app has performed in terms of throughput. If business is going well this graph will put a smile on your face, and if not then it will let you know immediately. Bumps in this graph can often be easily correlated to your marketing efforts or your product being picked up by a key influencer.
Performance
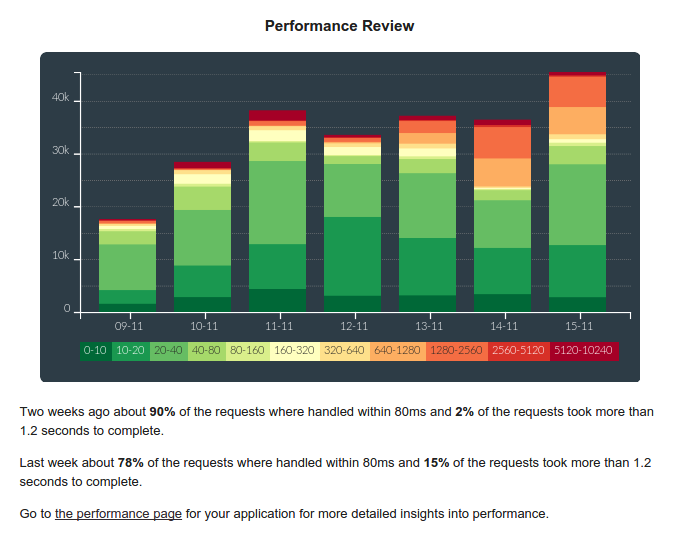
The performance review shows you a slightly more technical view of your application. It answers the question of how many requests were handled within an reasonable time frame. For the application shown in the image above, the bulk of the requests are in the green which is great. However starting on 13-11 there is a worrying increase in latency for a high percentage of requests. That is definitely a reason to click that link and dive into Union Station to find out what was bogging your application down during that period.
Deployments

The revisions segment is straight-forward. It shows you how many deployments your application has seen this week, compared to the week before. This statistic helps you keep track of how fast your team is moving.
Hardware load
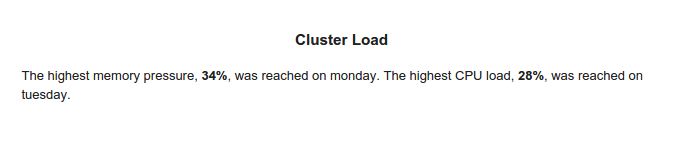
Lastly there is a short segment on the average load of your cluster. It's good to keep an eye on your system load to know when it might be a good time to invest in some extra hardware.
Conclusion
The weekly summary is a great way of staying up to date with the health of your application. It provides you with an insight on you how your request throughput has evolved over the past two weeks and what performance characteristics your application has seen. The summary also includes a quick view on how often your application has been deployed, and what load your hardware has been on.
If you are interested in receiving the summary and are not a Union Station user already, then be sure to check out the free trial!
 Follow on Github